Google Ads Metrics that Matter
In business, numbers speak better than a thousand words. Google offers data that help to estimate the overall efficiency of your campaigns. You should always monitor your ads performance. It’s crucial to estimate their efficiency and optimize your advertising campaigns relying upon Google Ads data analysis. With this data, you’ll be able to learn which advertising strategies perform best, spot areas that need improvement, and receive insights on how to cut down Google Ads cost.
ROAS, CPA, CPC, CTR, CR, and Quality Score are the most important Google Ads metrics. In this guide, I’m giving you a detailed explanation about what they all mean plus how you should interpret them.
Return on Advertising Spend (ROAS)
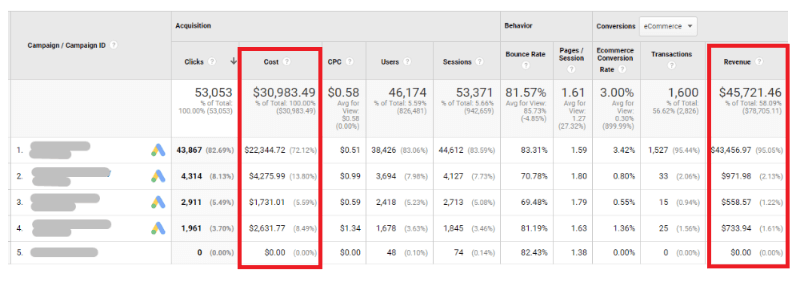
ROAS (Return on Advertising Spend) is a figure that says how much you earn with your adverts. It’s easy to find out ROAS. Divide your Google Ads cost by the profit you earn from adverts and then multiply this value by 100%. You can look up this data in your Google Ads reports:

However, you don’t have to find out ROAS manually as it’s available in your Google Analytics account. Just go to “Clicks” in the Google Ads report:

If your ROAS goes beyond 100%, it means that your campaign is producing revenue. Look at this: if ROAS=200%, you earn $2 for every $1 spent on the campaign. If ROAS equals 100%, you aren’t generating any income: for $1 invested in adverts, you get the same $1. Finally, when ROAS is less than 100%, let’s say 50%, you’re losing money: you earn $0.5 while you spend $1 on ads.
Get this - a user who once saw your advert online might buy your product in an offline store or via social media. Obviously, your ad succeeded in generating income, however, it’s not reflected by the ROAS value.
ROAS can say a lot about how efficient your marketing efforts are, but I recommend that you take into account your ROI as well. ROAS doesn’t incorporate margins of your products and may mislead you. So you should monitor both ROAS and ROI to achieve good results.
You can find out ROI manually in the following way:
(profit ✕ product margin - ad cost) / ad cost ✕ 100%
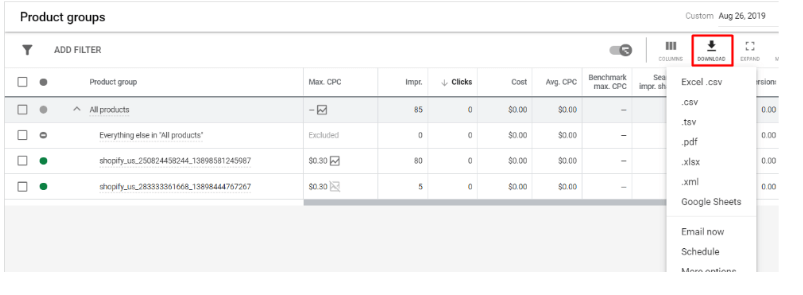
First off, transfer the data to a Google Sheet. For that, navigate to Product Groups:

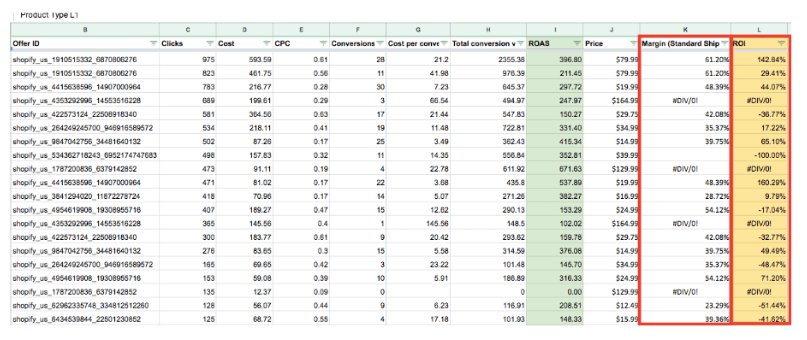
Now, edit the sheet, adding margin values in each line:

It looks time-consuming, right? Still, it’s a reliable method of evaluating the efficiency of your ads. But if you don’t have enough time for this, you can entrust your calculations to specialized online tools like RecommendMe.
Cost per Click (CPC) and Cost per Acquisition (CPA)
Let’s move on to another two noteworthy Google metrics: CPC and CPA.
CPC (cost per click) is how much you pay for each click. Google CPC rate greatly affects your return on investment, and that’s why it’s one of the indicators you should constantly watch. Cost per click is limited by an established maximum bid, and can’t go higher than that. Also, get this - ad rank, which assigns the position of the advert, is calculated in this way:
ad rank = max. CPC ✕ Quality Score.
CPA (cost per acquisition) means how much you spend on each certain action of the user. These can include purchases, price list downloads, email subscriptions - any action that can be recognized as valuable for you.
Analysing these Google Ads metrics, it’s easy to figure out how fruitful your ads campaign is. And remember that it’s normal when your average CPA goes beyond average CPC, as not every user, who clicks on the advert, completes a conversion.

Keep track of average CPC because it gives you an opportunity to estimate your advertising spends. Rocketing Google CPC rates don’t always mean high ROI, so if you think that you pay too much for a click, you should revisit your campaign and draw up steps for further optimization.
Clickthrough Rate (CTR)
CTR (clickthrough rate) is a Google Ads metric that tells you how many people who saw your advert actually clicked on it. You can estimate Google Ads CTR in this way:
CTR = clicks / impressions.
Practically, Google Ads clickthrough rate shows how appealing your ad is for the users and how clearly it reflects their intent.
It’s a no-brainer that marketers aim at achieving the highest Google Ads CTR. It’s beneficial for the Quality Score, it improves ad position, and lowers Google Ads cost by cutting down cost-per-click.
As a rule, CTR is affected by the position of your advertisement, but the position isn’t the ultimate factor that determines the clickthrough rate. You can still obtain a higher CTR at a lower position that can be determined by a low max. CPC. So you’d better not concentrate on the top ad unit and thus avoid wasting your budget.
So how can you boost your CTR? Create at least three different ad copies and test them. Then, try out different versions of call-to-action to spot the one that drives users who are most likely to click. Monitor your ads performance and discover which ad copies get most clicks.
Sure, CTR is one of the key figures to watch, but keep in mind that you don’t need to focus on a high CTR when your goal is more impressions. Actually, it greatly depends on your keywords: the more keywords that are likely to drive irrelevant traffic you utilize, the poorer your CTR is. It’s normal when you want to reach new audiences. However, make sure to keep the whole thing balanced, as a low CTR can badly affect the Quality Score.
Conversion Rate (CR)
Now, let’s dive deeper into Google Ads analysis. In this section, I’ll tell you about one of the key indicators of your ads performance: conversion rate.
Conversion is defined as any action that you recognise as a valuable one for your business. Conversions aren’t restricted to purchases.They can include phone calls, email subscriptions, price list downloads, etc. The conversion rate reflects the ratio between the users who completed a conversion action and those who clicked on your advertisement.

Accordingly, CR is calculated in the following way:
CR = conversions / ad clicks.
In essence, this percentage tells you how often a click ends up with a conversion. There’s no universal best minimum rate: they differ depending upon products and services that businesses offer.
To wrap it up, high CRs indicate the efficiency of your ad campaigns and prove the success of your business. CR enables you to figure out the efficiency of certain keywords, landing pages, and ad copies, as well as get clues about potential growth.
Quality Score
Quality Score is a Google Ads metric that mirrors the quality of the advertisement and is expressed by a number from one to ten. Quality Score is assigned by Google to estimate, which position the advert can occupy in paid search ranking. Plus, Quality Score affects your average CPC: the higher Quality Score is, the less you pay for a click.
What influences Quality Score? For starters, it’s an expected CTR. Machine learning figures out the expected Google Ads CTR relying upon their previous performance. It means that if people clicked on your ad earlier, it is going to receive approximately the same number of clicks.
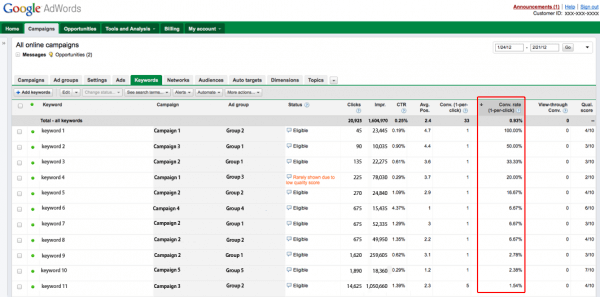
To learn the Quality Score of your adverts, navigate to Google Ads reports. Open Google Ads and click on the Keywords tab. Select Columns and include the Quality Score column. Now, you’ll see the Quality Score values for your keywords in Google Ads reports.

How should you interpret the scores? Let me explain.
1 - It’s the poorest score and it can mean that your site is either already banned from SERP or Google is just about to do it. Anyway, you still pay a lot for impressions, and maybe it’s time to hit pause on this campaign.
2-3 - Your website isn’t going to be banned, but your adverts are killing your budget.
4-6 - It’s still no good at the moment, however, with these scores, you can begin optimizing your campaign and eventually, come to better results.
7-8 - These scores indicate good quality of adverts.
9-10 - The top scores. You’ve done an impressive job: your average CPC becomes lower, and your adverts get higher.
As you can see, the low values of the Quality Score drain your budget and aren’t likely to bring any good results. This metrics is highly focused on the user’s experience with your advertisements. To reach the highest scores, craft useful content and improve the quality of your landing pages. Also, elaborate on your keywords and don’t miss out on utilizing negative keywords. On the ads level, make your ad copies relevant and attractive: test different CTAs, include all possible extensions, make sure that each headline contains a keyword. Also, you can try combining up to five regular adverts and a responsive one in the same group to better match the user’s intent.
Conclusions
All in all, there’s always much to monitor and analyse in your Google Ads campaigns. Although you may find Google Ads data analysis time-consuming and complicated, you need to do it if you want to achieve the best results. The optimization process is impossible without data analysis. But if you want to save your time and efforts, you can utilize online tools like RecommendMe. The specialized platform will track and analyse the data and identify areas in your campaigns that need improvement.


